There have been numerous attempts to explain the lackluster performance of value investing so far this decade, which is currently on pace for its worst annualized performance for a decade since the 1930s:

Without getting into the arguments made by others, which have been debated elsewhere, I will take a deeper look into what I think is the likeliest explanation for this phenomenon, although it is already almost twenty years old. This explanation comes from William Bernstein, who noted all the way back in 2001 that there is a close, positive connection between value’s performance (as measured by the Fama-French HmL portfolio), and inflation (graphic from William Bernstein):
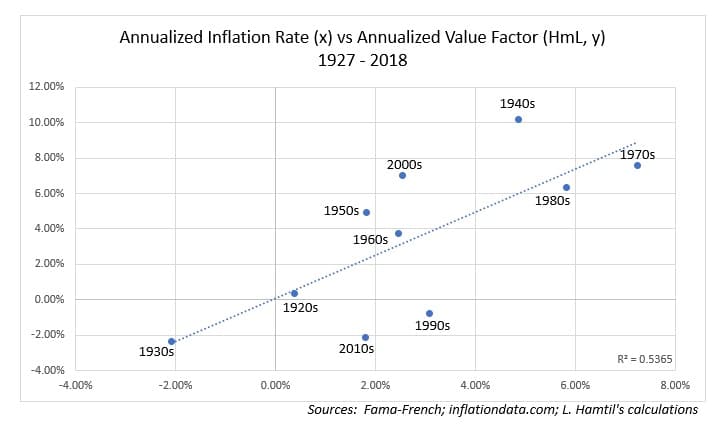
As Bernstein noted, there are few data points with which to work, but the connection is there. Updating the chart with with almost two more decades of inflation and return data reveals that the relationship still holds true:
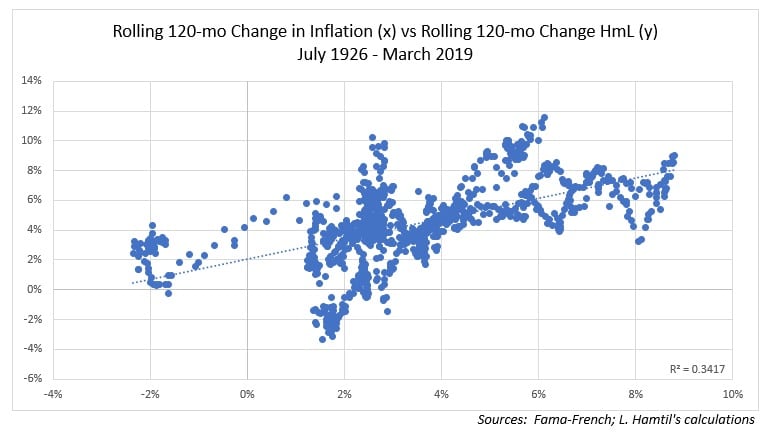
Over rolling ten-year periods, the relationship is not as cleanly observable, but is nevertheless still evident: higher inflation is generally coincident with higher value portfolio returns:
Now, the question remains, of course: why would inflation help value stocks? For William Bernstein, the explanation lay in inflation’s impact on growth stocks’ earnings. Earnings for growth stocks are typically forecast well out into the future, and rarely if ever catch up to those of more mature ‘value’ companies. Inflationary pressures compound this problem, as the future earnings streams on which the growth investor counts are eaten away. Inflation impacts the earnings forecast of value stocks, too, but the impact is much higher for growth stocks, as their valuations are much more reliant on future earnings.
A similar explanation is one with which bond investors will be familiar, and that is the simple link among inflation, interest rates, and duration. Simply put, higher inflation means higher interest rates, and higher rates are a clear negative for higher duration financial instruments. If we think of stocks like we think of bonds (and there is a reason you should!), it makes sense intuitively that value stocks would have a lower duration overall than growth stocks, as they are, by definition, higher-yielding. By ‘higher-yielding’ I mean they have higher earnings yields (the inverse of the P/E ratio) than growth stocks do, and, as we know, just like a higher yielding bond should have, all else equal, a lower duration than a lower yielding bond, so, too, should a higher-yielding stock have a lower duration than a low-yielding stock. Certainly, there will be some exceptions to this rule; after all, utilities typically have higher-than-average dividend yields, and typically fall into the ‘value’ pool, but, broadly speaking, there is significant evidence to suggest that value stocks do indeed have lower duration than growth stocks.
In my opinion, however, despite the elegance of these explanations, they do not go far enough in terms of explaining the value-inflation link. I am tempted to think the explanation is far simpler than most imagine, and I will demonstrate why.
First of all, how are we measuring value? In the Fama-French model, the ‘value factor’ or HmL, which stands for “High Minus Low”, is measured by the price-to-book ratio. Essentially, the argument Professors Fama and French make is that portfolios based on low price-to-book (P/B) values outperform those with higher P/B values. But the significant flaw in this measure is that unlike other valuation metrics, it opens up the portfolio to significant sector bias. Consider that over the last fifty or so years, two sectors, technology and healthcare, usually ranked the highest in terms of high P/B ratios, and thus would most likely be excluded from a HmL-based portfolio (graphic from Patrick O’Shaughnessy):
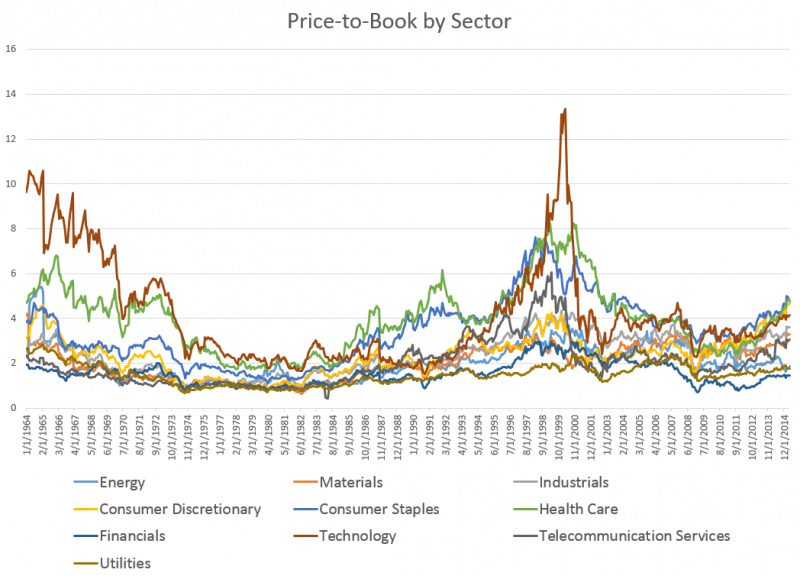
Conversely, financials and energy typically ranked among the lowest P/B sectors, and thus would most likely be core holdings in a HmL-based portfolio.
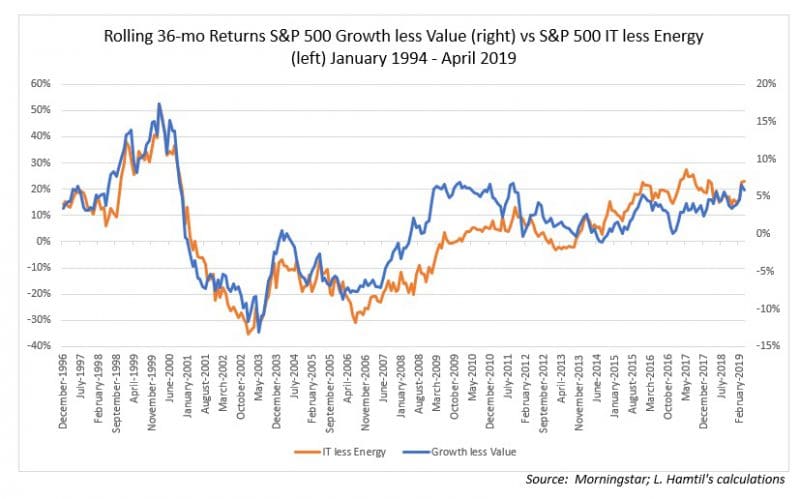
This sector bias has a material impact on portfolio performance. Consider recent history and the relative performance of the S&P 500 and S&P 500 growth indices with the IT and energy sectors. The return series are 88% correlated over the period:
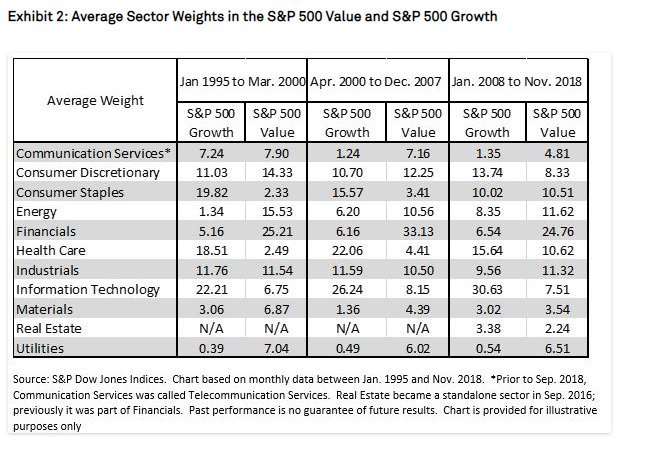
Similarly, this table from S&P shows how the P/B ratio, a key metric used in the construction of the two indices, can distort the relative performance as the “growth” portfolio is almost always biased to IT and healthcare, while financials and energy typically dominate the ‘value’ index:
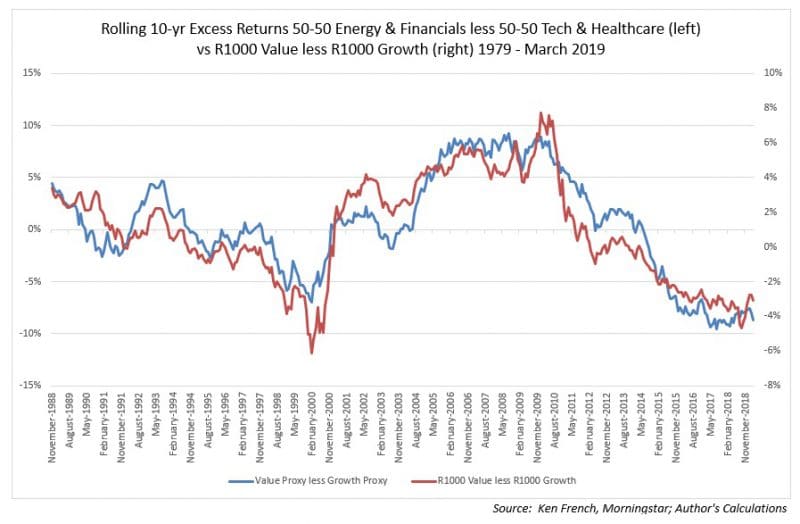
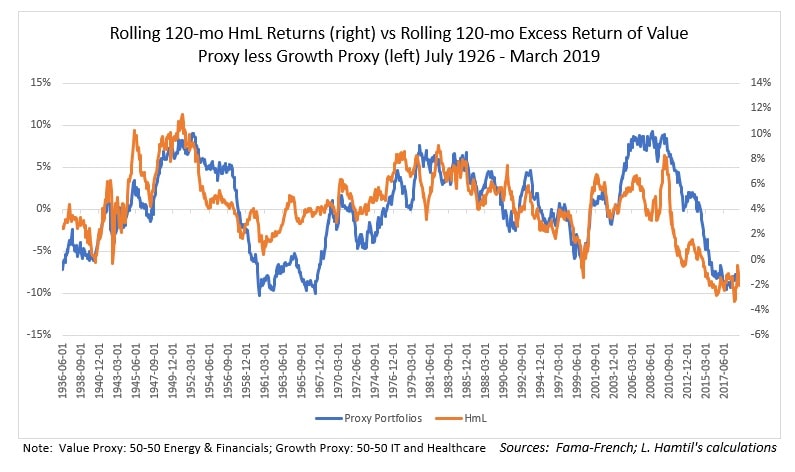
Now, to my knowledge, historical index composition data are not available, but using intuition, we can deduce from Patrick’s graph that these sector biases have been more or less steady over time. Using Professor Ken French’s “10 Industry” portfolios as proxies, we can see that there is similarly high correlation between the relative performance of the Russell 1000 Growth and Value indices and proxy portfolios of 50% IT and 50% healthcare (the ‘growth’ proxy), and 50% financials and 50% energy (the ‘value’ proxy):
While not as tight, the correlation of the Value and Growth proxy portfolios is still strong going back to 1926:
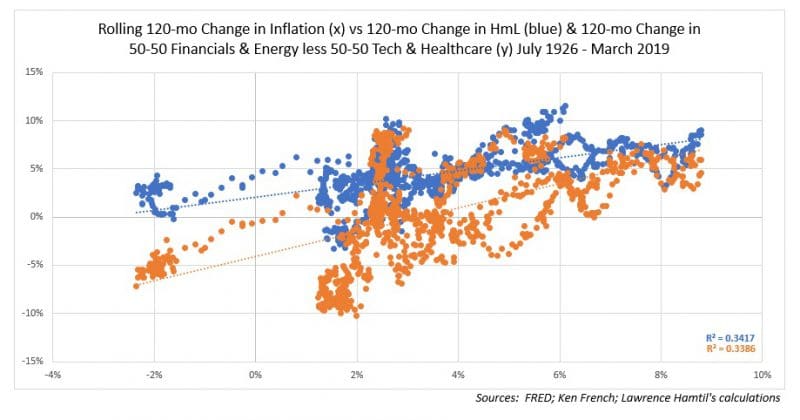
What is more is that we can see that inflation’s impact on both the HmL and proxy portfolios is very similar, with both the relationship patterns and R2 values being very close:
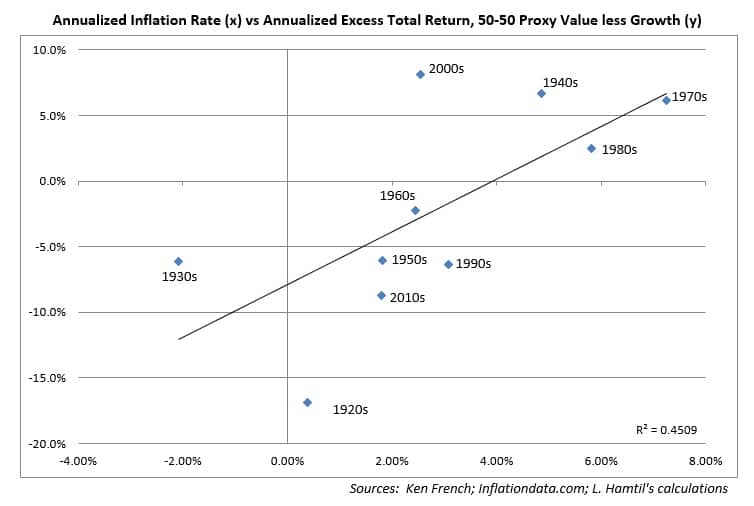
We can even match up, more or less, the relationship William Bernstein demonstrated between HmL performance and annualized inflation by decade:
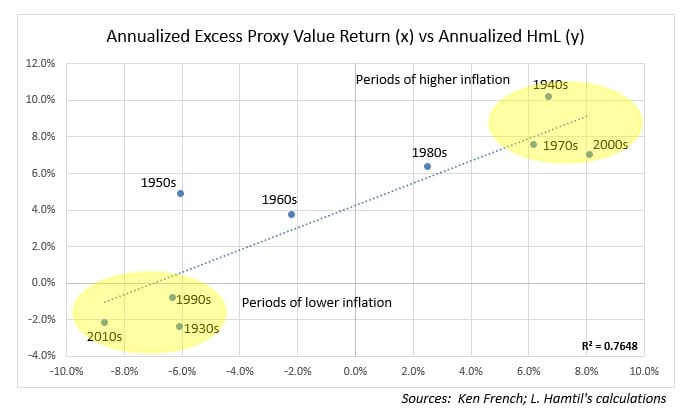
The outlier in this case is the decade of the 1920s, so we can look at the relationship another way, which is to exclude the 1920s altogether, – keep in mind, in the dataset, the 1920s includes just a few years of data, and the healthcare and IT industries were nascent, to say the least, – and we can plot the annualized returns by decade for both the HmL portfolio and the proxy portfolios and see that they cluster together pretty well in terms of inflationary versus disinflationary periods:
I should say that some will argue that inflation was low during the 2000s, but this is misleading; commodity prices such as gold and oil surged throughout the decade, and so while official measures may have shown somewhat tame inflation, input costs as far as raw materials were concerned were elevated. This brings me to my conclusion, which is why, when it is all said and done, should inflation benefit portfolios that are heavily concentrated in energy and financials? As we have discussed elsewhere, the relationship is actually pretty simple: energy stocks benefit from higher energy costs, and financial stocks benefit from higher interest rates, both of which are products of higher inflation. Conversely, while the relationships are not nearly as well explored, IT stocks have demonstrated negative sensitivity to commodity price increases, perhaps because they are input costs for them. Whatever the case, the relationship seems clear to this observer: the classic price-to-book value portfolio is essentially a bet on long-term inflationary pressures continuing to benefit certain segments of the equity market at the expense of others. Investors in these types of portfolios should consider whether they are comfortable with these implicit bets, and whether they would not be better off constructing more portfolios built on more flexible measures of value, with fewer implicit macro bets.