The start of a new year is a good time to take stock of the global equity markets and to see what lessons can be learned from the last few decades of cycles and drawdowns.
For the S&P 500, which represents for our purposes the U.S. global equity market, the largest drawdown by percent occurred in the midst of the 2007-2009 financial crisis, when the S&P 500 total return index dropped about 51%. However, the S&P 500 fully recovered from this steep drawdown within 53 months, whereas it took 73 months – almost two more years – to recover from the tech bubble bursting, even though the total drawdown was somewhat less severe:

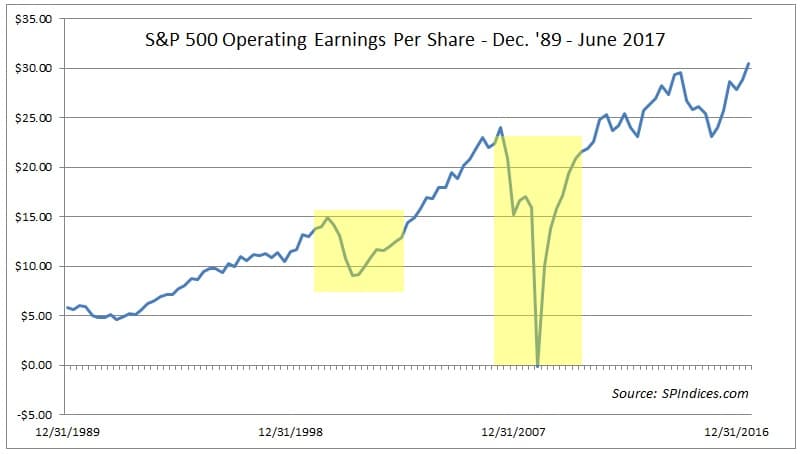
This can perhaps more easily be seen in the following graphic showing S&P 500 operating earnings over the last ~30 years. Even though the decline in index earnings during the ’00-’02 bear market was relatively small compared to the huge drop from ’07-’09, the index recovered much more quickly from the steeper decline as it entered the downturn with more balance and with valuations less stretched:

The lesson here is that investors, especially those who index by market weight exclusively, should be wary when one sector begins to dominate the index, or when valuations hit extreme levels, as was the case when technology shares constituted more than one-third of the S&P 500 at the peak of the tech bubble in early 2000.
Interestingly, globalization seems to have increased not just correlation among world economies, but also among world equity markets. This is evidenced by the fact that just as with the S&P 500, non-U.S. tech shares suffered a massive drawdown following the tech bust, while non-U.S. financial stocks fell in unison with U.S. financial stocks during the ’07-’09 period. Unlike their U.S. counterparts, however, non-U.S. technology and financial shares are still below their peak levels, however, being in the midst of 17 and 10 year drawdowns, respectively:

Interestingly, in some ways, the aftermath of the financial crisis was the opposite of the tech boom. Because most non-U.S. developed markets are heavily concentrated in financial stocks, they felt the effects of the financial crisis much more severely than did U.S. stocks, which, over the last few decades have become increasingly dominated by technology shares, even at the small- and mid-cap levels. Similarly, because non-U.S. shares have comparatively little exposure to technology shares, they recovered much more quickly from the tech bust than did U.S. markets. This makes the case for global diversification if for no other reason than to impose a little more balance across sectors, which, increasingly, trade together, even at the global level.
Finally, in the emerging markets space, it should be noted that drawdowns have generally been a little steeper across the spectrum, which probably has as much to do with currency volatility as with earnings and valuations. Secondly, emerging markets were the last global region to recover from the financial crisis, taking almost ten years to do so. It should be noted that the MSCI EM index (which is what illustrated here) has evolved considerably over the last decade to include more technology and fewer energy and bank shares, which is a main reason why the broader index has now recovered fully from the financial crisis even while several formerly key sectors have not:

It is worth noting that whether measured in the U.S., foreign developed, or EM, certain sectors like consumer staples and healthcare have shown “defensive” qualities, which is to say that their drawdowns have tended to be both shallower and of shorter duration than both more cyclical sectors, and the broader indices. This is likely because their products and services are in need whether the times are good or bad, economically speaking. While earnings data for foreign markets are unavailable, a glance at the earnings for S&P 500 consumer staples versus S&P 500 financials is revealing, and probably similar to the experience of other world markets:

In sum, after a year such as 2017 when almost all sectors and world equity markets rallied strongly, and when valuations across the globe leave little room for error, investors would do well to check on the balance of their portfolios, both from a geographical and sector perspective, in order not to get caught flat-footed when the cycle changes, and the next series of drawdowns occurs.
Note: I excluded the telecommunications sector from analysis in all markets as the sector is now being phased out in favor of a new “media” sector.
I would like to thank my friend Nick (@nickatfp on Twitter) for his help in the formulaic and graphic illustrations of the drawdown data.